如果需要严格画图,用一般的画图软件往往会引入误差。即使通过输入坐标来调整位置,也显得十分繁琐。由于转角石墨烯对画图精确度要求很高,因此这里使用 Python 的 matplotlib 来画示意图,保存 eps 矢量图后还可以通过 AI 等软件做进一步处理。
除此之外,还可以通过 Pybinding 等软件包进行画图。
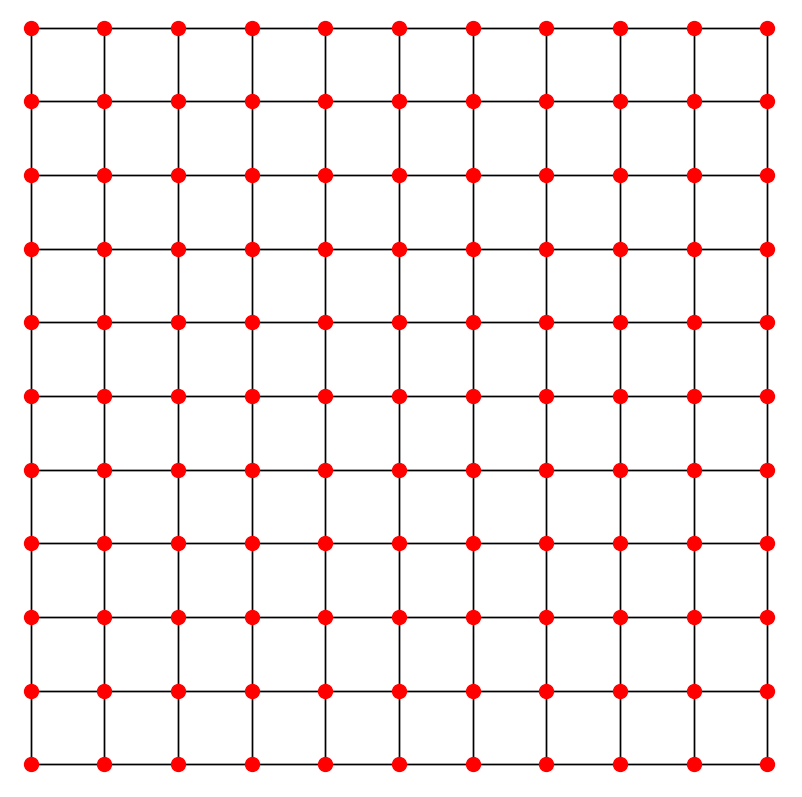
一、方格子
python 代码:
"""
This code is supported by the website: https://www.guanjihuan.com
The newest version of this code is on the web page: https://www.guanjihuan.com/archives/10909
"""

import numpy as np


def main():
    x_array = np.arange(-5, 5.1)
    y_array = np.arange(-5, 5.1)
    coordinates = []
    for x in x_array:
        for y in y_array:
            coordinates.append([x, y])
    plot_dots(coordinates)


def plot_dots(coordinates):
    import matplotlib.pyplot as plt
    fig, ax = plt.subplots(figsize=(9,9))
    plt.subplots_adjust(left=0.05, bottom=0.05, right=0.95, top=0.95)
    plt.axis('off')
    for i1 in range(len(coordinates)):
        for i2 in range(len(coordinates)):
            if np.sqrt((coordinates[i1][0] - coordinates[i2][0])**2+(coordinates[i1][1] - coordinates[i2][1])**2) < 1.1:
                ax.plot([coordinates[i1][0], coordinates[i2][0]], [coordinates[i1][1], coordinates[i2][1]], '-k', linewidth=1)
    for i in range(len(coordinates)):
        ax.plot(coordinates[i][0], coordinates[i][1], 'ro', markersize=10)
    # plt.savefig('square.eps')
    plt.show()


if __name__ == '__main__':
    main()
运行结果:
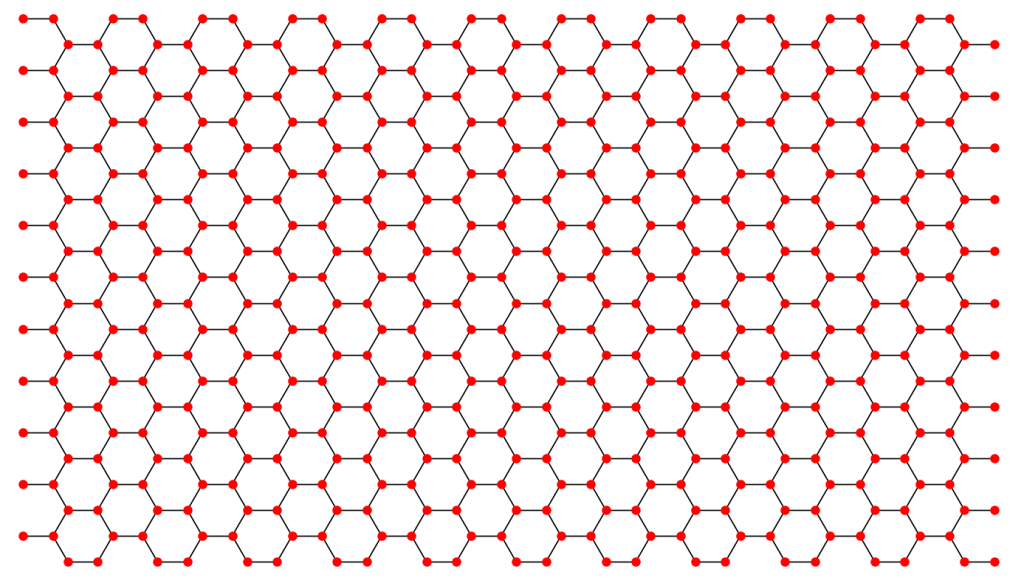
二、石墨烯
python 代码:
"""
This code is supported by the website: https://www.guanjihuan.com
The newest version of this code is on the web page: https://www.guanjihuan.com/archives/10909
"""

import numpy as np


def main():
    x_array = np.arange(-5, 5.1)
    y_array = np.arange(-5, 5.1)
    coordinates = []
    for x in x_array:
        for y in y_array:
            coordinates.append([0+x*3, 0+y*np.sqrt(3)])
            coordinates.append([1+x*3, 0+y*np.sqrt(3)])
            coordinates.append([-1/2+x*3, np.sqrt(3)/2+y*np.sqrt(3)])
            coordinates.append([-3/2+x*3, np.sqrt(3)/2+y*np.sqrt(3)])
    plot_dots(coordinates)


def plot_dots(coordinates):
    import matplotlib.pyplot as plt
    x_range = max(np.array(coordinates)[:, 0])-min(np.array(coordinates)[:, 0])
    y_range = max(np.array(coordinates)[:, 1])-min(np.array(coordinates)[:, 1])
    fig, ax = plt.subplots(figsize=(9*x_range/y_range,9))
    plt.subplots_adjust(left=0.05, bottom=0.05, right=0.95, top=0.95)
    plt.axis('off')
    for i1 in range(len(coordinates)):
        for i2 in range(len(coordinates)):
            if np.sqrt((coordinates[i1][0] - coordinates[i2][0])**2+(coordinates[i1][1] - coordinates[i2][1])**2) < 1.1:
                ax.plot([coordinates[i1][0], coordinates[i2][0]], [coordinates[i1][1], coordinates[i2][1]], '-k', linewidth=1)
    for i in range(len(coordinates)):
        ax.plot(coordinates[i][0], coordinates[i][1], 'ro', markersize=8)
    # plt.savefig('graphene.eps')
    plt.show()


if __name__ == '__main__':
    main()
运行结果:
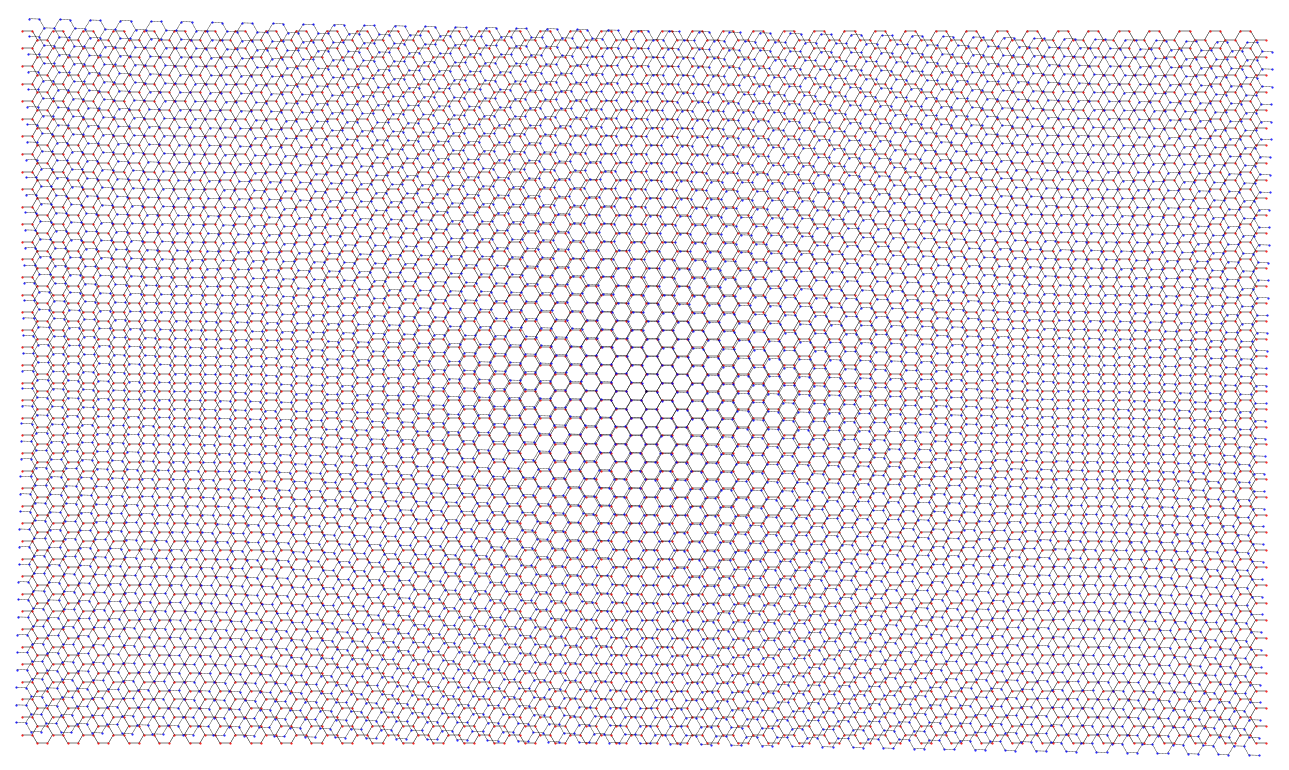
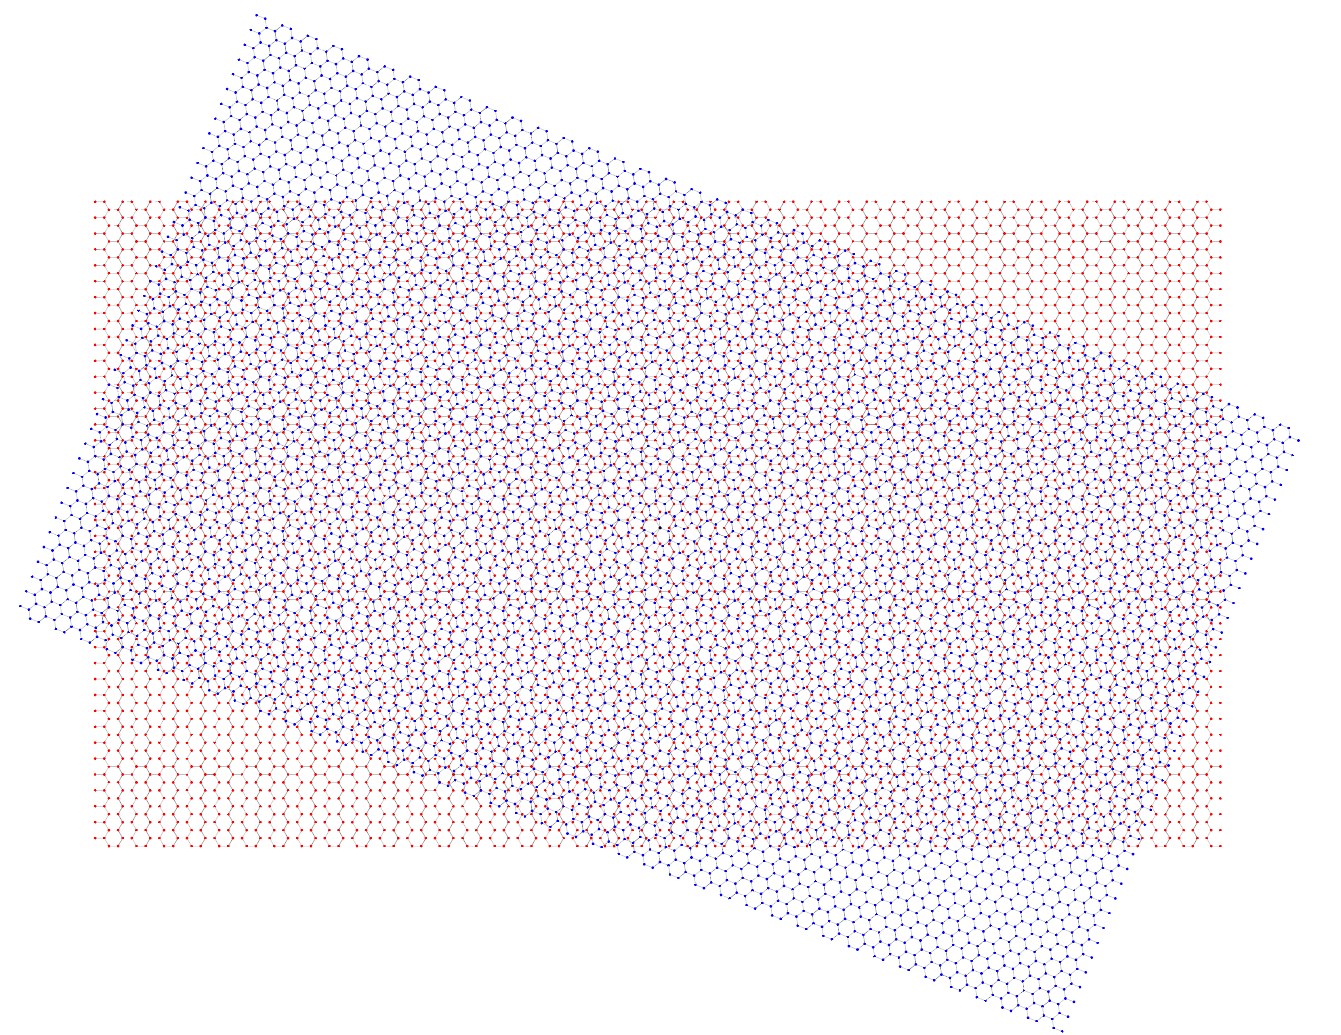
三、转角石墨烯
python 代码:
"""
This code is supported by the website: https://www.guanjihuan.com
The newest version of this code is on the web page: https://www.guanjihuan.com/archives/10909
"""

import numpy as np
import copy
import matplotlib.pyplot as plt
from math import *

def main():
    x_array = np.arange(-20, 20.1)
    y_array = np.arange(-20, 20.1)
    coordinates = []
    for x in x_array:
        for y in y_array:
            coordinates.append([0+x*3, 0+y*np.sqrt(3)])
            coordinates.append([1+x*3, 0+y*np.sqrt(3)])
            coordinates.append([-1/2+x*3, np.sqrt(3)/2+y*np.sqrt(3)])
            coordinates.append([-3/2+x*3, np.sqrt(3)/2+y*np.sqrt(3)])
    x_range1 = max(np.array(coordinates)[:, 0])-min(np.array(coordinates)[:, 0])
    y_range1 = max(np.array(coordinates)[:, 1])-min(np.array(coordinates)[:, 1])

    theta = -1.1/180*pi
    rotation_matrix = np.zeros((2, 2))
    rotation_matrix[0, 0] = np.cos(theta)
    rotation_matrix[1, 1] = np.cos(theta)
    rotation_matrix[0, 1] = -np.sin(theta)
    rotation_matrix[1, 0] = np.sin(theta)
    coordinates2 = copy.deepcopy(coordinates)
    for i in range(len(coordinates)):
        coordinates2[i] = np.dot(rotation_matrix, coordinates[i])
    x_range2 = max(np.array(coordinates2)[:, 0])-min(np.array(coordinates2)[:, 0])
    y_range2 = max(np.array(coordinates2)[:, 1])-min(np.array(coordinates2)[:, 1])

    x_range = max([x_range1, x_range2])
    y_range = max([y_range1, y_range2])
    fig, ax = plt.subplots(figsize=(9*x_range/y_range,9))
    plt.subplots_adjust(left=0.05, bottom=0.05, right=0.95, top=0.95)
    plt.axis('off')
    plot_dots_1(ax, coordinates)
    plot_dots_2(ax, coordinates2)
    plot_dots_0(ax, [[0, 0]])
    plt.savefig('twist_graphene.eps')
    plt.show()


def plot_dots_0(ax, coordinates):
    for i in range(len(coordinates)):
        ax.plot(coordinates[i][0], coordinates[i][1], 'ko', markersize=0.5)


def plot_dots_1(ax, coordinates):
    for i1 in range(len(coordinates)):
        for i2 in range(len(coordinates)):
            if np.sqrt((coordinates[i1][0] - coordinates[i2][0])**2+(coordinates[i1][1] - coordinates[i2][1])**2) < 1.1:
                ax.plot([coordinates[i1][0], coordinates[i2][0]], [coordinates[i1][1], coordinates[i2][1]], '-k', linewidth=0.2)
    for i in range(len(coordinates)):
        ax.plot(coordinates[i][0], coordinates[i][1], 'ro', markersize=0.5)


def plot_dots_2(ax, coordinates):
    for i1 in range(len(coordinates)):
        for i2 in range(len(coordinates)):
            if np.sqrt((coordinates[i1][0] - coordinates[i2][0])**2+(coordinates[i1][1] - coordinates[i2][1])**2) < 1.1:
                ax.plot([coordinates[i1][0], coordinates[i2][0]], [coordinates[i1][1], coordinates[i2][1]], '--k', linewidth=0.2)
    for i in range(len(coordinates)):
        ax.plot(coordinates[i][0], coordinates[i][1], 'bo', markersize=0.5)


if __name__ == '__main__':
    main()
运行结果(转角1.1度):
运行结果(转角21.8度):
【说明:本站主要是个人笔记和代码的分享,内容可能会不定期修改。目前文章支持直接转载,引用或转载请注明出处:https://www.guanjihuan.com 。本站采用知识共享署名许可协议 CC BY】
关老师您好,转角石墨烯氮化硼异质结的结构怎么搭建呀,二者的晶格常数不一样,而且还有转角
根据晶格常数的比值,等比例设置两层画图的线的长度。
关哥你好,我自己编程建完图(转角双层石墨烯)后老师给出如下评论和要求:
“非周期的两片石墨烯片,任意角度的位置坐标已经实现,但无法直接用在周期性程序计算中。我们的第一阶段目标就是产生周期性任意角度的晶胞结构,这是几何问题,很多人都解决了。你可以查查文献,都有相应的几何公式或者程序 ”
然后我就利用双层晶格原胞基矢(观察双层石墨烯周期性)获得了基矢内的原子位置,不过由于基矢只能通过肉眼观察周期性确定,老师又说:
“等于周期性还得人工判断,再取舍坐标,所以周期性还是没有实现。。。,我们需要的是程序自动给出任意角度的最小周期结构,这也就是为什么上面会问很多问题,因为人为画周期容易出错,如果转角接近或小于1度,人为会非常困难且麻烦 ”
到这一步我实在想不到办法怎么解决,关哥有办法或者推荐一些相关文献,或者能给我讲解一下思路吗
····from 某刚入门小白
在有些旋转角度下是没有周期性元胞的,因此找不到也是正常的。一些经典的旋转角度的周期性很多文献都给出了,这个可以参考下文献。
我目前没研究这个方向,不清楚给个角度是否有判断存在元胞的公式,你可以自己调研下。
程序上找的话,这里提供一个思路:可以先计算得到足够多的双层格点的坐标,然后给一个坐标组,分别包含上下两层的一个格点的坐标,用第一层的基矢量来判断第二层的原子是否有重叠,找到最近的一个重叠坐标组就可以了,最后把其他格点进行平移作为测试。
程序上暴力寻找也有个问题,就是如果找不到不代表一定没有元胞,也可能是因为格点取的数量不够多,是否有元胞只能通过数学来证明了。
就是用来跑分子动力学,转角双层石墨烯的模型在x和y方向要具有周期性,但是由于莫尔纹周期性的限制,这里需要考虑到莫尔纹的周期性,盒子大小以及模型要怎末切除,需要代码实现的话具体应该怎末写呢,谢谢
在某些旋转角度下是有周期性的,需要根据具体情况进行裁剪,几乎接近于手动输入所有的坐标吧。如果是非公度的角度,没有周期性,这没法裁剪,需要做其他的一些近似。
你好,请问如果要在模型中加入周期性边界条件的话,这个代码要怎末写呢
这里给出的示意图。如果需要在哈密顿量中加入周期性边界条件,只需要在对应的元素上加上边界之间的跃迁项。